Consider the function y=k/y. The graph of this function is a line, called a hyperbola in mathematics. The general view of a hyperbola is shown in the figure below. (The graph shows the function y equals k divided by x, for which k equals one.)
It can be seen that the graph consists of two parts. These parts are called branches of the hyperbola. It is also worth noting that each branch of the hyperbola approaches in one of the directions closer and closer to the coordinate axes. The coordinate axes in this case are called asymptotes.
In general, any straight lines to which the graph of a function infinitely approaches but does not reach them are called asymptotes. A hyperbola, like a parabola, has axes of symmetry. For the hyperbola shown in the figure above, this is the line y=x.
Now let's look at two common cases of hyperbole. The graph of the function y = k/x, for k ≠0, will be a hyperbola, the branches of which are located either in the first and third coordinate angles, for k>0, or in the second and fourth coordinate angles, for k<0.
Basic properties of the function y = k/x, for k>0

Graph of the function y = k/x, for k>0
5. y>0 at x>0; y6. The function decreases both on the interval (-∞;0) and on the interval (0;+∞).
10. The range of values of the function is two open intervals (-∞;0) and (0;+∞).
Basic properties of the function y = k/x, for k<0

Graph of the function y = k/x, at k<0
1. Point (0;0) is the center of symmetry of the hyperbola.
2. Coordinate axes - asymptotes of the hyperbola.
4. The domain of definition of the function is all x except x=0.
5. y>0 at x0.
6. The function increases both on the interval (-∞;0) and on the interval (0;+∞).
7. The function is not limited either from below or from above.
8. A function has neither a maximum nor a minimum value.
9. The function is continuous on the interval (-∞;0) and on the interval (0;+∞). Has a gap at x=0.
1. Fractional linear function and its graph
A function of the form y = P(x) / Q(x), where P(x) and Q(x) are polynomials, is called a fractional rational function.
You are probably already familiar with the concept of rational numbers. Likewise rational functions are functions that can be represented as the quotient of two polynomials.
If a fractional rational function is the quotient of two linear functions - polynomials of the first degree, i.e. function of the form
y = (ax + b) / (cx + d), then it is called fractional linear.
Note that in the function y = (ax + b) / (cx + d), c ≠ 0 (otherwise the function becomes linear y = ax/d + b/d) and that a/c ≠ b/d (otherwise the function is constant ). The linear fractional function is defined for all real numbers except x = -d/c. Graphs of fractional linear functions do not differ in shape from the graph y = 1/x you know. A curve that is a graph of the function y = 1/x is called hyperbole. With an unlimited increase in x in absolute value, the function y = 1/x decreases unlimited in absolute value and both branches of the graph approach the abscissa: the right one approaches from above, and the left one from below. The lines to which the branches of a hyperbola approach are called its asymptotes.
Example 1.
y = (2x + 1) / (x – 3).
Solution.
Let's select the whole part: (2x + 1) / (x – 3) = 2 + 7/(x – 3).
Now it is easy to see that the graph of this function is obtained from the graph of the function y = 1/x by the following transformations: shift by 3 unit segments to the right, stretching along the Oy axis 7 times and shifting by 2 unit segments upward.
Any fraction y = (ax + b) / (cx + d) can be written in a similar way, highlighting the “integer part”. Consequently, the graphs of all fractional linear functions are hyperbolas, shifted in various ways along the coordinate axes and stretched along the Oy axis.
To construct a graph of any arbitrary fractional linear function It is not at all necessary to transform the fraction defining this function. Since we know that the graph is a hyperbola, it will be enough to find the straight lines to which its branches approach - the asymptotes of the hyperbola x = -d/c and y = a/c.
Example 2.
Find the asymptotes of the graph of the function y = (3x + 5)/(2x + 2).
Solution.
The function is not defined, at x = -1. This means that the straight line x = -1 serves as a vertical asymptote. To find the horizontal asymptote, let’s find out what the values of the function y(x) approach when the argument x increases in absolute value.
To do this, divide the numerator and denominator of the fraction by x:
y = (3 + 5/x) / (2 + 2/x).
As x → ∞ the fraction will tend to 3/2. This means that the horizontal asymptote is the straight line y = 3/2.
Example 3.
Graph the function y = (2x + 1)/(x + 1).
Solution.
Let’s select the “whole part” of the fraction:
(2x + 1) / (x + 1) = (2x + 2 – 1) / (x + 1) = 2(x + 1) / (x + 1) – 1/(x + 1) =
2 – 1/(x + 1).
Now it is easy to see that the graph of this function is obtained from the graph of the function y = 1/x by the following transformations: a shift by 1 unit to the left, a symmetrical display with respect to Ox and a shift by 2 unit segments up along the Oy axis.
Domain D(y) = (-∞; -1)ᴗ(-1; +∞).
Range of values E(y) = (-∞; 2)ᴗ(2; +∞).
Intersection points with axes: c Oy: (0; 1); c Ox: (-1/2; 0). The function increases at each interval of the domain of definition.
Answer: Figure 1.
2. Fractional rational function
Consider a fractional rational function of the form y = P(x) / Q(x), where P(x) and Q(x) are polynomials of degree higher than first.
Examples of such rational functions:
y = (x 3 – 5x + 6) / (x 7 – 6) or y = (x – 2) 2 (x + 1) / (x 2 + 3).
If the function y = P(x) / Q(x) represents the quotient of two polynomials of degree higher than the first, then its graph will, as a rule, be more complex, and it can sometimes be difficult to construct it accurately, with all the details. However, it is often enough to use techniques similar to those we have already introduced above.
Let the fraction be a proper fraction (n< m). Известно, что любую несократимую рациональную дробь можно представить, и притом единственным образом, в виде суммы конечного числа элементарных дробей, вид которых определяется разложением знаменателя дроби Q(x) в произведение действительных сомножителей:
P(x)/Q(x) = A 1 /(x – K 1) m1 + A 2 /(x – K 1) m1-1 + … + A m1 /(x – K 1) + …+
L 1 /(x – K s) ms + L 2 /(x – K s) ms-1 + … + L ms /(x – K s) + …+
+ (B 1 x + C 1) / (x 2 +p 1 x + q 1) m1 + … + (B m1 x + C m1) / (x 2 +p 1 x + q 1) + …+
+ (M 1 x + N 1) / (x 2 +p t x + q t) m1 + … + (M m1 x + N m1) / (x 2 +p t x + q t).
Obviously, the graph of a fractional rational function can be obtained as the sum of graphs of elementary fractions.
Plotting graphs of fractional rational functions
Let's consider several ways to construct graphs of a fractional rational function.
Example 4.
Draw a graph of the function y = 1/x 2 .
Solution.
We use the graph of the function y = x 2 to construct a graph of y = 1/x 2 and use the technique of “dividing” the graphs.
Domain D(y) = (-∞; 0)ᴗ(0; +∞).
Range of values E(y) = (0; +∞).
There are no intersection points with the axes. The function is even. Increases for all x from the interval (-∞; 0), decreases for x from 0 to +∞.
Answer: Figure 2.
Example 5.
Graph the function y = (x 2 – 4x + 3) / (9 – 3x).
Solution.
Domain D(y) = (-∞; 3)ᴗ(3; +∞).
y = (x 2 – 4x + 3) / (9 – 3x) = (x – 3)(x – 1) / (-3(x – 3)) = -(x – 1)/3 = -x/ 3 + 1/3.
Here we used the technique of factorization, reduction and reduction to a linear function.
Answer: Figure 3.

Example 6.
Graph the function y = (x 2 – 1)/(x 2 + 1).
Solution.
The domain of definition is D(y) = R. Since the function is even, the graph is symmetrical about the ordinate. Before building a graph, let’s transform the expression again, highlighting the whole part:
y = (x 2 – 1)/(x 2 + 1) = 1 – 2/(x 2 + 1).
Note that isolating the integer part in the formula of a fractional rational function is one of the main ones when constructing graphs.
If x → ±∞, then y → 1, i.e. the straight line y = 1 is a horizontal asymptote.
Answer: Figure 4.
Example 7.
Let's consider the function y = x/(x 2 + 1) and try to accurately find its largest value, i.e. the highest point on the right half of the graph. To accurately construct this graph, today's knowledge is not enough. Obviously, our curve cannot “rise” very high, because the denominator quickly begins to “overtake” the numerator. Let's see if the value of the function can be equal to 1. To do this, we need to solve the equation x 2 + 1 = x, x 2 – x + 1 = 0. This equation has no real roots. This means our assumption is incorrect. To find the largest value of the function, you need to find out at what largest A the equation A = x/(x 2 + 1) will have a solution. Let's replace the original equation with a quadratic one: Ax 2 – x + A = 0. This equation has a solution when 1 – 4A 2 ≥ 0. From here we find the largest value A = 1/2. 
Answer: Figure 5, max y(x) = ½.
Still have questions? Don't know how to graph functions?
To get help from a tutor, register.
The first lesson is free!
website, when copying material in full or in part, a link to the source is required.
Let us choose a rectangular coordinate system on the plane and plot the values of the argument on the abscissa axis X, and on the ordinate - the values of the function y = f(x).
Function graph y = f(x) is the set of all points whose abscissas belong to the domain of definition of the function, and the ordinates are equal to the corresponding values of the function.
In other words, the graph of the function y = f (x) is the set of all points of the plane, coordinates X, at which satisfy the relation y = f(x).

In Fig. 45 and 46 show graphs of functions y = 2x + 1 And y = x 2 - 2x.
Strictly speaking, one should distinguish between a graph of a function (the exact mathematical definition of which was given above) and a drawn curve, which always gives only a more or less accurate sketch of the graph (and even then, as a rule, not the entire graph, but only its part located in the final parts of the plane). In what follows, however, we will generally say “graph” rather than “graph sketch.”
Using a graph, you can find the value of a function at a point. Namely, if the point x = a belongs to the domain of definition of the function y = f(x), then to find the number f(a)(i.e. the function values at the point x = a) you should do this. It is necessary through the abscissa point x = a draw a straight line parallel to the ordinate axis; this line will intersect the graph of the function y = f(x) at one point; the ordinate of this point will, by virtue of the definition of the graph, be equal to f(a)(Fig. 47).

For example, for the function f(x) = x 2 - 2x using the graph (Fig. 46) we find f(-1) = 3, f(0) = 0, f(1) = -l, f(2) = 0, etc.
A function graph clearly illustrates the behavior and properties of a function. For example, from consideration of Fig. 46 it is clear that the function y = x 2 - 2x takes positive values when X< 0 and at x > 2, negative - at 0< x < 2; smallest value function y = x 2 - 2x accepts at x = 1.
To graph a function f(x) you need to find all the points of the plane, coordinates X,at which satisfy the equation y = f(x). In most cases, this is impossible to do, since there are an infinite number of such points. Therefore, the graph of the function is depicted approximately - with greater or lesser accuracy. The simplest is the method of plotting a graph using several points. It consists in the fact that the argument X give a finite number of values - say, x 1, x 2, x 3,..., x k and create a table that includes the selected function values.
The table looks like this:
Having compiled such a table, we can outline several points on the graph of the function y = f(x). Then, connecting these points with a smooth line, we get an approximate view of the graph of the function y = f(x).
It should be noted, however, that the multi-point plotting method is very unreliable. In fact, the behavior of the graph between the intended points and its behavior outside the segment between the extreme points taken remains unknown.
Example 1. To graph a function y = f(x) someone compiled a table of argument and function values:
The corresponding five points are shown in Fig. 48.

Based on the location of these points, he concluded that the graph of the function is a straight line (shown in Fig. 48 by the dotted line). Can this conclusion be considered reliable? Unless there are additional considerations to support this conclusion, it can hardly be considered reliable. reliable.
To substantiate our statement, consider the function
![]() .
.
Calculations show that the values of this function at points -2, -1, 0, 1, 2 are exactly described by the table above. However, the graph of this function is not a straight line at all (it is shown in Fig. 49). Another example would be the function y = x + l + sinπx; its meanings are also described in the table above.

These examples show that in its “pure” form the method of plotting a graph using several points is unreliable. Therefore, to plot a graph of a given function, one usually proceeds as follows. First, we study the properties of this function, with the help of which we can build a sketch of the graph. Then, by calculating the values of the function at several points (the choice of which depends on the established properties of the function), the corresponding points of the graph are found. And finally, a curve is drawn through the constructed points using the properties of this function.
We will look at some (the simplest and most frequently used) properties of functions used to find a graph sketch later, but now we will look at some commonly used methods for constructing graphs.
Graph of the function y = |f(x)|.
It is often necessary to plot a function y = |f(x)|, where f(x) - given function. Let us remind you how this is done. A-priory absolute value numbers can be written
![]()
This means that the graph of the function y =|f(x)| can be obtained from the graph, function y = f(x) as follows: all points on the graph of the function y = f(x), whose ordinates are non-negative, should be left unchanged; further, instead of the points of the graph of the function y = f(x) having negative coordinates, you should construct the corresponding points on the graph of the function y = -f(x)(i.e. part of the graph of the function
y = f(x), which lies below the axis X, should be reflected symmetrically about the axis X).

Example 2. Graph the function y = |x|.
Let's take the graph of the function y = x(Fig. 50, a) and part of this graph at X< 0 (lying under the axis X) symmetrically reflected relative to the axis X. As a result, we get a graph of the function y = |x|(Fig. 50, b).
Example 3. Graph the function y = |x 2 - 2x|.

First, let's plot the function y = x 2 - 2x. The graph of this function is a parabola, the branches of which are directed upward, the vertex of the parabola has coordinates (1; -1), its graph intersects the x-axis at points 0 and 2. In the interval (0; 2) the function takes negative values, therefore this part of the graph symmetrically reflected relative to the abscissa axis. Figure 51 shows the graph of the function y = |x 2 -2x|, based on the graph of the function y = x 2 - 2x
Graph of the function y = f(x) + g(x)
Consider the problem of constructing a graph of a function y = f(x) + g(x). if function graphs are given y = f(x) And y = g(x).
Note that the domain of definition of the function y = |f(x) + g(x)| is the set of all those values of x for which both functions y = f(x) and y = g(x) are defined, i.e. this domain of definition is the intersection of the domains of definition, functions f(x) and g(x).
Let the points (x 0 , y 1) And (x 0, y 2) respectively belong to the graphs of functions y = f(x) And y = g(x), i.e. y 1 = f(x 0), y 2 = g(x 0). Then the point (x0;. y1 + y2) belongs to the graph of the function y = f(x) + g(x)(for f(x 0) + g(x 0) = y 1 +y2),. and any point on the graph of the function y = f(x) + g(x) can be obtained this way. Therefore, the graph of the function y = f(x) + g(x) can be obtained from function graphs y = f(x). And y = g(x) replacing each point ( x n, y 1) function graphics y = f(x) dot (x n, y 1 + y 2), Where y 2 = g(x n), i.e. by shifting each point ( x n, y 1) function graph y = f(x) along the axis at by the amount y 1 = g(x n). In this case, only such points are considered X n for which both functions are defined y = f(x) And y = g(x).
This method of plotting a function y = f(x) + g(x) is called addition of graphs of functions y = f(x) And y = g(x)
Example 4. In the figure, a graph of the function was constructed using the method of adding graphs
y = x + sinx.
When plotting a function y = x + sinx we thought that f(x) = x, A g(x) = sinx. To plot the function graph, we select points with abscissas -1.5π, -, -0.5, 0, 0.5,, 1.5, 2. Values f(x) = x, g(x) = sinx, y = x + sinx Let's calculate at the selected points and place the results in the table.
Maintaining your privacy is important to us. For this reason, we have developed a Privacy Policy that describes how we use and store your information. Please review our privacy practices and let us know if you have any questions.
Collection and use of personal information
Personal information refers to data that can be used to identify or contact a specific person.
You may be asked to provide your personal information at any time when you contact us.
Below are some examples of the types of personal information we may collect and how we may use such information.
What personal information do we collect:
- When you submit an application on the site, we may collect various information, including your name, telephone number, address Email etc.
How we use your personal information:
- The personal information we collect allows us to contact you and inform you about unique offers, promotions and other events and upcoming events.
- From time to time, we may use your personal information to send important notices and communications.
- We may also use personal information for internal purposes, such as conducting audits, data analysis and various research in order to improve the services we provide and provide you with recommendations regarding our services.
- If you participate in a prize draw, contest or similar promotion, we may use the information you provide to administer such programs.
Disclosure of information to third parties
We do not disclose the information received from you to third parties.
Exceptions:
- If necessary, in accordance with the law, judicial procedure, in legal proceedings, and/or based on public inquiries or requests from government agencies on the territory of the Russian Federation - disclose your personal information. We may also disclose information about you if we determine that such disclosure is necessary or appropriate for security, law enforcement, or other public importance purposes.
- In the event of a reorganization, merger, or sale, we may transfer the personal information we collect to the applicable successor third party.
Protection of personal information
We take precautions - including administrative, technical and physical - to protect your personal information from loss, theft, and misuse, as well as unauthorized access, disclosure, alteration and destruction.
Respecting your privacy at the company level
To ensure that your personal information is secure, we communicate privacy and security standards to our employees and strictly enforce privacy practices.
The length of the segment on the coordinate axis is determined by the formula:
The length of a segment on the coordinate plane is found using the formula:
To find the length of a segment in a three-dimensional coordinate system, use the following formula:
The coordinates of the middle of the segment (for the coordinate axis only the first formula is used, for the coordinate plane - the first two formulas, for a three-dimensional coordinate system - all three formulas) are calculated using the formulas:
Function– this is a correspondence of the form y= f(x) between variable quantities, due to which each considered value of some variable quantity x(argument or independent variable) corresponds to specific value another variable, y(dependent variable, sometimes this value is simply called the value of the function). Note that the function assumes that one argument value X only one value of the dependent variable can correspond at. However, the same value at can be obtained with different X.
Function Domain– these are all the values of the independent variable (function argument, usually this X), for which the function is defined, i.e. its meaning exists. The area of definition is indicated D(y). By and large, you are already familiar with this concept. The domain of a function is also called the domain acceptable values, or ODZ, which you have long been able to find.
Function Range- this is all possible values dependent variable of this function. Designated E(at).
Function increases on the interval in which a larger value of the argument corresponds to a larger value of the function. The function is decreasing on the interval in which a larger value of the argument corresponds to a smaller value of the function.
Intervals of constant sign of a function- these are the intervals of the independent variable over which the dependent variable retains its positive or negative sign.
Function zeros– these are the values of the argument at which the value of the function is equal to zero. At these points, the function graph intersects the abscissa axis (OX axis). Very often, the need to find the zeros of a function means the need to simply solve the equation. Also, often the need to find intervals of constancy of sign means the need to simply solve the inequality.
Function y = f(x) are called even X
![]()
This means that for any opposite values of the argument, the values of the even function are equal. Schedule even function always symmetrical relative to the ordinate axis of the op-amp.
Function y = f(x) are called odd, if it is defined on a symmetric set and for any X from the domain of definition the equality holds:
![]()
This means that for any opposite values of the argument, the values of the odd function are also opposite. The graph of an odd function is always symmetrical about the origin.
The sum of the roots of even and odd functions(points of intersection of the abscissa axis OX) is always equal to zero, because for every positive root X has a negative root - X.
It is important to note: some function does not have to be even or odd. There are many functions that are neither even nor odd. Such functions are called functions general view , and for them none of the equalities or properties given above is satisfied.
Linear function is a function that can be given by the formula:
The graph of a linear function is a straight line and in the general case looks like this (an example is given for the case when k> 0, in this case the function is increasing; for the occasion k < 0 функция будет убывающей, т.е. прямая будет наклонена в другую сторону - слева направо):

Graph of a quadratic function (Parabola)
The graph of a parabola is given by a quadratic function:
A quadratic function, like any other function, intersects the OX axis at the points that are its roots: ( x 1 ; 0) and ( x 2 ; 0). If there are no roots, then the quadratic function does not intersect the OX axis; if there is only one root, then at this point ( x 0 ; 0) the quadratic function only touches the OX axis, but does not intersect it. The quadratic function always intersects the OY axis at the point with coordinates: (0; c). Schedule quadratic function(parabola) may look like this (the figure shows examples that are far from exhaustive possible types parabolas):

Wherein:
- if the coefficient a> 0, in function y = ax 2 + bx + c, then the branches of the parabola are directed upward;
- if a < 0, то ветви параболы направлены вниз.
The coordinates of the vertex of a parabola can be calculated using the following formulas. X tops (p- in the pictures above) parabolas (or the point at which the quadratic trinomial reaches its largest or smallest value):
Igrek tops (q- in the figures above) parabolas or the maximum if the branches of the parabola are directed downwards ( a < 0), либо минимальное, если ветви параболы направлены вверх (a> 0), value quadratic trinomial:
Graphs of other functions
Power function
Here are some examples of graphs of power functions:

Inversely proportional is a function given by the formula:
Depending on the sign of the number k back schedule proportional dependence may have two fundamental options:

Asymptote is a line that the graph of a function approaches infinitely close to but does not intersect. Asymptotes for graphs inverse proportionality shown in the figure above are the coordinate axes to which the graph of the function approaches infinitely close, but does not intersect them.
Exponential function with base A is a function given by the formula:
a The graph of an exponential function can have two fundamental options (we also give examples, see below):

Logarithmic function is a function given by the formula:
Depending on whether the number is greater or less than one a The graph of a logarithmic function can have two fundamental options:

Graph of a function y = |x| as follows:

Graphs of periodic (trigonometric) functions
Function at = f(x) is called periodic, if there is such a non-zero number T, What f(x + T) = f(x), for anyone X from the domain of the function f(x). If the function f(x) is periodic with period T, then the function:
Where: A, k, b are constant numbers, and k not equal to zero, also periodic with period T 1, which is determined by the formula:
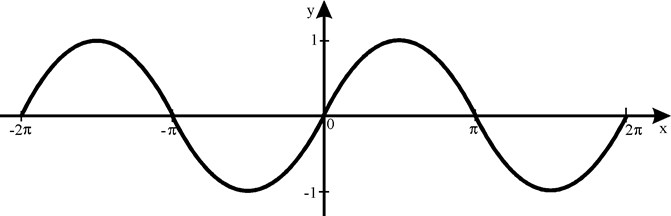
Most examples periodic functions These are trigonometric functions. Here are the graphs of the main trigonometric functions. The following figure shows part of the graph of the function y= sin x(the entire graph continues indefinitely left and right), graph of the function y= sin x called sinusoid:
Graph of a function y=cos x called cosine. This graph is shown in the following figure. Since the sine graph continues indefinitely along the OX axis to the left and right:

Graph of a function y= tg x called tangentoid. This graph is shown in the following figure. Like the graphs of other periodic functions, this schedule repeats indefinitely along the OX axis to the left and right.

And finally, the graph of the function y=ctg x called cotangentoid. This graph is shown in the following figure. Like the graphs of other periodic and trigonometric functions, this graph repeats indefinitely along the OX axis to the left and right.

Successful, diligent and responsible implementation of these three points will allow you to show up on the CT excellent result, the maximum of what you are capable of.
Found a mistake?
If you think you have found an error in educational materials, then please write about it by email. You can also report a bug to social network(). In the letter, indicate the subject (physics or mathematics), the name or number of the topic or test, the number of the problem, or the place in the text (page) where, in your opinion, there is an error. Also describe what the suspected error is. Your letter will not go unnoticed, the error will either be corrected, or you will be explained why it is not an error.