Enterprises that produce goods or provide services in large assortment, are forced to carry out comparative analysis business units of the company to decide on the allocation of investment resources. Maximum financial investments are received by the priority area of the company's activity that brings maximum profit. Tool for management product range acts as the BCG matrix, an example of the construction and analysis of which helps marketers make decisions on the development or liquidation of a company’s business units.
The concept and essence of the BCG matrix
Formation of long-term plans for the company, proper distribution financial resources between the components of a firm's strategic portfolio occurs through the use of a tool created by the Boston Consulting Group. Hence the name of the tool - the BCG matrix. An example of building a system is based on the dependence of the relative market share on its growth rate.
The competitiveness of a product is expressed by the indicator of relative market share and is plotted on the X-axis. An indicator whose value is greater than one is considered high.
The attractiveness and maturity of the market is characterized by the value of its growth rate. Data for this parameter are plotted on the matrix along the Y axis.
After calculating the relative share and growth rate of the market for each good that the company produces, the data is transferred to a system called the BCG matrix (an example of the system will be discussed below).

Matrix quadrants
When product groups are distributed according to the BCG model, each assortment unit falls into one of the four quadrants of the matrix. Each quadrant has its own name and recommendations for making decisions. Below is a table consisting of the same categories as the BCG matrix, an example of the construction and analysis of which cannot be done without knowledge of the features of each zone.
|
|
| Cash cows
|
Objects of analysis
An example of constructing and analyzing the BCG matrix is impossible without identifying the goods that can be considered in the projection of this system.
- Lines of business that are not related to each other. This could be: hairdressing services and the production of electric kettles.
- Assortment groups of a company sold in one market. For example, selling apartments, renting apartments, selling houses, and the like. That is, the real estate market is being considered.
- Products classified into one group. For example, the production of tableware products made of glass, metal or ceramics.
BCG matrix: example of construction and analysis in Excel
For determining life cycle product and strategic planning of the marketing activities of an enterprise, an example with fictitious data will be considered to understand the topic of the article.
The first stage is the collection and tabulation of data on the analyzed goods. This operation is simple; you need to create a table in Excel and enter the company data into it.

The second step is calculating market indicators: growth rate and relative share. To do this, you will need to enter formulas for automatic calculation into the cells of the created table:
- In cell E3, which will contain the value of the market growth rate, this formula looks like this: =C3/B3. If you get a lot of decimal places, then you need to reduce the bit depth to two.
- The procedure is similar for each product.
- In cell F9, which is responsible for relative market share, the formula looks like this: = C3/D3.
The result is a completed table.

According to the table, it can be seen that sales of the first product fell by 37% in 2015, and sales of product 3 increased by 49%. Competitiveness or relative market share for the first product category is lower than that of competitors by 47%, but for the third and fourth products it is higher by 33% and 26%, respectively.
Graphic display
Based on the table data, a BCG matrix is constructed, an example of which in Excel is based on choosing a “Bubble” type chart.
After selecting the chart type, an empty field appears, by right-clicking on which you need to open a window for selecting data to fill out the future matrix.
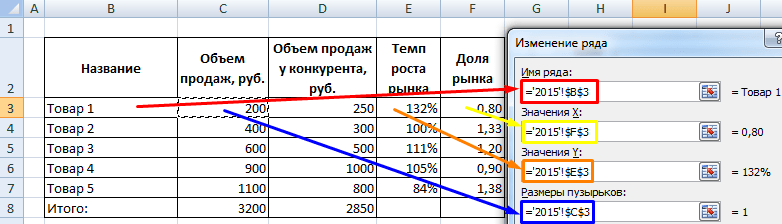
By adding a row, its data is filled in. Each row is a product of the enterprise. For the first product the data will be as follows:
- The row name is cell A3.
- X axis - cell F3.
- The Y axis is cell E3.
- The bubble size is cell C3.

This is how the BCG matrix is created (for all four goods), the example of constructing the remaining goods is similar to the first.
Changing the Axes Format
When all the products are graphically displayed on the diagram, you need to divide it into quadrants. This distinction is made by the X and Y axes. You only need to change the automatic settings of the axes. By clicking the mouse on the vertical scale, the “Format” tab is selected and the “Format Selection” window is called up on the left side of the panel.
Changing the vertical axis:
- The maximum value is the average ODR multiplied by 2: (0.53+0.56+1.33+1.26)/4=0.92; 0.92*2=1.84.
- The main and intermediate divisions are the average ODR.
- The intersection with the X axis is the average ODR.

Changing the horizontal axis:
- The minimum value is assumed to be “0”.
- The maximum value is assumed to be “2”.
- The remaining parameters are "1".

The resulting diagram is the BCG matrix. An example of constructing and analyzing such a model will give an answer about the priority development of the company’s assortment units.
Signatures
To finally complete the construction of the BCG system, it remains to create the signatures of the axes and quadrants. You need to select the diagram and go to the “Layout” section of the program. Using the “Inscription” icon, move the cursor to the first quadrant and write its name. This procedure is repeated in the next three zones of the matrix.
To create a title for the diagram, which is located in the center of the BCG model, select the icon of the same name, next to the “Inscription”.
Following from left to right on the panel Excel tools 2010 of the “Layout” section, similar to the previous labels, axis labels are created. As a result, the BCG matrix, an example of construction of which in Excel was considered, has the following form:

Analysis of assortment units
Drawing a diagram of the dependence of market share on its growth rate is half the solution to the problem of strategic marketing. The crucial point is correct interpretation position of goods on the market and the choice of further actions (strategies) for their development or liquidation. BCG matrix, example of analysis:
Product No. 1 is located in the area of low market growth and relative share. This product item has already passed its life cycle and does not bring profit to the company. In a real situation, it would be necessary to conduct a detailed analysis of such goods and determine the conditions for their release in the absence of profit from their sale. Theoretically, it is better to exclude this product group and direct the released resources to the development of promising goods.
Product No. 2 is in a growing market, but requires investment to increase competitiveness. It is a promising product.
Product #3 is at the peak of its life cycle. This type assortment unit has high ODR indicators and market growth rates. An increase in investment is required so that in the future the business unit of the company producing this product will generate stable income.
Product No. 4 is a profit generator. It is recommended to direct the funds received by the company from the sale of this category of assortment unit to the development of goods No. 2, 3.
Strategies
An example of the construction and analysis of the BCG matrix helps to highlight the following four strategies.
- Increasing market share. Such a development plan is acceptable for products located in the “Wild Cats” zone, with the goal of moving them to the “Stars” quadrant.
- Maintaining market share. To obtain a stable income from Cash Cows, it is recommended to use this strategy.
- Decrease in market share. Let's apply the plan to weak "Cash Cows", "Dogs" and unpromising "Wildcats".
- Elimination is the strategy for the Dogs and the hopeless Wildcats.
BCG matrix: example of construction in Word
The method of building a model in Word is more labor-intensive and not entirely clear. An example will be considered based on the data that was used to construct the matrix in Excel.
Product | Revenue, monetary units | Sales volume of the leading competitor, monetary units. | Estimated indicators | Market growth rate, % |
||
2014 | 2015 | Market growth rate | Relative market share |
|||
The “Market Growth Rate” column appears, the values of which are calculated as follows: (1-growth rate data)*100%.
A table of four rows and columns is built. The first column is combined into one cell and labeled “Market Growth Rate”. In the remaining columns, you need to combine rows in pairs so that you get two large cells at the top of the table and two rows left at the bottom. As in the picture.
In the lowest line there will be a coordinate “Relative market share”, above it - values: less or more than 1. Referring to the table data (its last two columns), the definition of goods by quadrant begins. For example, for the first product, ODR = 0.53, which is less than one, means its location will be either in the first or fourth quadrant. The market growth rate is negative, equal to -37%. Since the growth rate in the matrix is divided by a value of 10%, then clearly product number 1 falls into the fourth quadrant. The same distribution occurs with the remaining assortment units. The result should match the Excel diagram.
The BCG matrix: an example of construction and analysis determines the strategic positions of the company’s assortment units and participates in decision-making on the distribution of enterprise resources.
With help this example BCG matrices of the enterprise you can improve the company’s product portfolio without much effort. The example contains detailed description each step in constructing the BCG matrix, a template for constructing the BCG matrix in Excel, and tips on the likely conclusions that should be drawn as a result of the analysis of the BCG matrix.
Fig. 1 BCG matrix
Theoretical information
Before studying the example of the BCG matrix, we recommend reading the detailed article “The Matrix of the Boston Consulting Group: detailed review"with a description of the main characteristics and mechanisms of operation of the BCG matrix, with tips for creating an impeccable backpack and interpreting the results.
1st step: Gathering initial information
Collect sales and profit data for the analyzed groups into a single table.

Step 2: Calculate market growth rate
Calculate the weighted average market growth rate for each product group. If it is not possible to calculate the weighted average market growth rate, it is possible to simply introduce market share into the model.

In accordance with the data obtained, determine the market growth rate for each product in the analysis:
- if the growth rate is less than 10% - “small”
- if the market growth rate is more than 10% - “highest”
3rd step: Calculation of product market share
Calculate the relative market share of each product. In accordance with the obtained data, determine for each product whether the relative market share is “low” or “highest”.
- if the value of the relative market share is less than 1 - “low”
- if the value of the relative market share is greater than 1 - “highest”
 If it is impossible to calculate the relative market share due to lack of information, it is permissible to use a lightweight option:
- if according to you expert assessment the share of your product is less than the share of your main rival - put “0″
- if, according to your expert assessment, the share of your product is greater than the share of your main rival, put “1″
4th step: An example of constructing a BCG matrix by sales volume
Now, knowing the relative market share of a product and the market growth rate, you can find for each product in the company’s backpack its place in the BCG matrix.
Based on the resulting information, build a BCG matrix, reflecting in each cell the name of the product, sales volume and total sales volume per group.

Analysis by sales volume allows you to judge how the company’s portfolio is balanced, helps to correctly prioritize product development values and highlight the main areas of business.
Step 5: An example of constructing a BCG matrix by profit volume
Construct a similar BCG matrix for profit, reflecting in each cell the name of the product, the volume of profit and the total profit for the group.

Analysis by profit volume allows one to judge the ability to invest and support new products of the company and helps to prioritize the values in supporting product groups.
Step 6: Conducting analysis, drawing conclusions and developing a strategy
Analyze the resulting BCG matrices by sales and profit volume, write conclusions and determine the company’s backpack development strategy.

The main conclusions should be outlined: (For detailed strategies for the development of groups according to the BCG matrix, read the article: BCG Matrix. Bases)
- Is the briefcase balanced or are there obvious differences from a perfect backpack?
- what product groups should be developed, what product groups should be reduced?
- values in the development of the company's product range?
- Can profits from current projects support new products?
- Does the company have enough products that can provide future foreign exchange earnings?
- What strategy in the development of each product group should be followed to maximize future income?
- Should we introduce some additional products into the range?
Ready solutions
We have ready-made template, with which you can easily apply theoretical knowledge this article in practice. You can download a template for constructing a BCG matrix in Excel format in the “Useful marketing templates” section.
The BCG matrix, also called “growth - market share,” is a simple and visual tool for portfolio analysis. The accessibility and originality of the names of the chart sectors made it very popular among marketers and managers. Let's look at the example of constructing a matrix in Excel.
Examples of using the BCG matrix
Using the Boston Consulting Group (BCG) matrix, you can quickly and clearly analyze product groups, branches of an enterprise or company based on their share in the corresponding market segment and market growth rate. The use of the tool is based on two hypotheses:
- The market leader has a competitive advantage in production costs. Therefore, the leading company has the highest profitability in the segment.
- To operate effectively in a fast-growing market, a company needs to invest a lot in the development of its product. Presence in a segment with a low growth rate allows the company to reduce this expense item.
Using the BCG matrix, you can quickly identify the most promising and weakest products (branches, companies). And based on the data obtained, make a decision: which assortment group (division) to develop and which to liquidate.
All analyzed elements after the analysis work fall into one of four quadrants:
- "Problems". Products in high-growth industries but with low market share. To strengthen their position in the market, significant financial investments are needed. When an assortment group or division falls into this quadrant, the enterprise decides whether it has sufficient funds to develop this area. Without cash injections, the product does not develop.
- "Stars". Business lines and products are leaders in a fast-growing market. The company's task is to support and strengthen these products. The best resources should be allocated to them, because... it is a stable source of profit.
- "Money bags." Products with a relatively high market share in a slow-growing segment. They do not require high investments and are the main generator Money. The proceeds from their sale should go to the development of “stars” or “wild cats”.
- "Dead weight". Feature– relatively low market share in a slowly growing segment. It makes no sense to develop these areas.
BCG matrix: example of construction and analysis in Excel
Let's consider the construction of the BCG matrix using the example of an enterprise. Preparation:


Construction of the BCG matrix
In Excel, a bubble chart is best suited for this purpose.

Using “Insert” we will add a construction area to the sheet. We enter the data for each row as follows:
On the horizontal axis – the relative market share (we set up a logarithmic scale: “Layout” - “Format of the horizontal axis”). Vertical – market growth rate. The diagram area is divided into 4 equal quadrants:

The central value for the market growth rate is 90%. For relative market share – 1.00. Taking this data into account, we will distribute product categories:

Conclusions:
- “Problems” - Product 1 and 4. Investment is needed to develop these items. Development scheme: creation competitive advantage– distribution – support.
- “Stars” - Product 2 and 3. The company has such categories - and this is a plus. At this stage, all you need is support.
- “Cash Cows” - Product 5. Brings a good profit, which can be used to finance other products.
- No dead weight found.
Ministry of Agrarian and Food Policy of Ukraine
Kharkiv National Agrarian University
Named after V.V. Dokuchaev
INDZ on the topic : “Analysis of the position of a product on the market using the additional BCG matrix”
Vikonav: 4th year student, 3rd group
Faculty: Management and Economics
Specialty: “Organization Management”
Shulzhenko Yu.A.
Verified by: Yulia Volodymyrivna
Kharkiv 2012
BCG Matrix 1
1.1Scope of application 2
1.2Description 3
BCG Matrix
Brownleft arrow- typical product life cycle, black arrows - typical investment flows
BKG Matrix(English) BCG matrix) - a tool for strategic analysis and planning in marketing. Created by the founder of the Boston consulting group, Bruce D. Henderson, to analyze the relevance of the company's products, based on their position in the market relative to the growth of the market for these products and the market share occupied by the company selected for analysis.
This tool is theoretically justified. It is based on two concepts: product life cycle* And economies of scale* or learning curve.
The matrix displays the axes of market growth (vertical axis) and market share (horizontal axis). The combination of assessments of these two indicators makes it possible to classify a product, highlighting four possible roles of the product for the company producing or selling it.
1.1Scope of application
The BCG matrix can be used in the process of strategic analysis and planning of a product program (product range), allowing for the correct distribution of resources between available products. Re-building the BCG matrix after a certain period of time can be useful in the controlling process.
1.2 Description
The Boston Matrix is based on a product life cycle model, according to which a product goes through four stages in its development: access to the market(product is a “problem”), height(star product), maturity(product - "cash cow") and recession(product - "dog"). The BCG matrix is a graphical representation of the positions of a specific type of business in the strategic space “growth rates / market share”.

* Product life cycle- the period of time during which a product circulates on the market, starting from the moment it enters the market market and ending with its withdrawal from the market. One of the fundamental concepts of the concept of modern marketing.

Graphs characterizing changes in indicators in various phases of the life cycle. 1-Phase of entering the market;
3-Maturity;
4-Decline: A - sales;
B - profit.

Various options for the product life cycle curve: 2 - repeated cycle;
3 - "comb" curve
According to the marketing concept, any product goes through a life cycle, that is, there is a certain period of time when it is present on the market. In a typical product life cycle, there are four phases, four stages:
1. Bringing a product to market. The first appearance of a product on the market. Characteristic is a slight increase in sales volumes and, accordingly, profits are minimal or non-existent.
2.Height. Period rapid growth sales volume if the product is accepted by the market and demand grows on him. Profits also increase as sales volume increases.
3.Maturity. Sales volumes are significant, but further sales growth is not observed. Profit at this stage has stabilized, since additional costs are not required to bring the product to the market.
4.Decline, leaving the market. This phase of the product’s life cycle is characterized by a significant decrease in sales volumes up to a complete drop in demand for this product. Profit drops sharply to zero.
Scale effect* associated with changes in the cost of a unit of output depending on the scale of its production by the company. Considered in the long term. Reducing costs per unit of production during the consolidation of production is called economies of scale. The shape of the long-term cost curve is associated with economies of scale in production.
Classifications of types of strategic business units:
"Stars"
High sales growth and high market share. Market share needs to be maintained and increased. "Stars" bring in a lot of income. But despite the attractiveness of this product, its net cash flow is quite low, as it requires significant investment to ensure a high growth rate.
"Cash Cows" ("Money Bags")
High market share, but low sales growth rate. “Cash cows” must be protected and controlled as much as possible. Their attractiveness is explained by the fact that they do not require additional investments and at the same time provide a good cash income. Funds from sales can be used to develop “Difficult Children” and support “Stars”.
"Dogs" ("Lame Ducks", "Dead Weight")
Growth rate is low, market share is low, product generally low level profitability and requires a lot of attention from the manager. We need to get rid of the “Dogs”.
"Problem Children" ("Wild Cats", "Dark Horses", "Question Marks")
Low market share, but high growth rates. “Difficult children” need to be studied. In the future, they can become both stars and dogs. If there is a possibility of transferring to the stars, then you need to invest, otherwise, get rid of it.
Flaws
Great simplification of the situation;
The model takes into account only two factors, but high relative market share is not the only factor of success, and high growth rates are not the only indicator of market attractiveness;
Lack of accounting financial aspect, the removal of dogs can lead to an increase in the cost of cows and stars, as well as a negative impact on the loyalty of customers using this product;
The assumption that market share corresponds to profit, this rule may be violated when introducing a new product to the market with large investment costs;
The assumption is that the market decline is caused by the end of the product's life cycle. There are other situations in the market, for example, the end of rush demand or an economic crisis.
Advantages
theoretical study of the relationship between financial receipts and analyzed parameters;
objectivity of the analyzed parameters (relative market share and market growth rate);
clarity of the results obtained and ease of construction;
it allows you to combine portfolio analysis with a product life cycle model;
simple and easy to understand;
It is easy to develop a strategy for business units and investment policies.
Construction rules
The horizontal axis corresponds to the relative market share, the coordinate space from 0 to 1 in the middle in increments of 0.1 and then from 1 to 10 in increments of 1. The assessment of market share is the result of an analysis of the sales of all industry participants. Relative market share is calculated as the ratio of one's own sales to the sales of the strongest competitor or the three strongest competitors, depending on the degree of concentration in a particular market. 1 means that your own sales are equal to those of your strongest competitor.
The vertical axis corresponds to the market growth rate. The coordinate space is determined by the growth rates of all company products from maximum to minimum; the minimum value can be negative if the growth rate is negative.
For each product, the intersection of the vertical and horizontal axis is established and a circle is drawn, the area of which corresponds to the product’s share in the company’s sales volumes.
BCG Matrix helps perform two functions: making decisions about intended positions in the market and distributing strategic funds between different zones management in the future.
Among the advantages of the BCG matrix as a tool strategic management First of all, it is worth noting its simplicity. The matrix is very useful when choosing between different agricultural sectors, determining strategic positions and when allocating resources for the near future. However, due to its simplicity, the BCG matrix has two significant disadvantages:
all SZHs, the situation in which the company is analyzed using the BCG matrix, must be in the same phase of life cycle development;
within the agricultural sector, competition should proceed in such a way that the indicators used are sufficient to determine the strength of the company’s competitive position.
If the first flaw is fatal, i.e. SZHs located at different stages of the life cycle cannot be analyzed using this matrix, then the second drawback can well be eliminated. In the process of improving the BCG matrix, the authors proposed completely different indicators. The main ones are presented in Table 2.
Table 2. Indicators for assessing the strategic position using the BCG matrix.
The indicator of a company's future competitiveness in the market is determined by the ratio of the expected return on capital and the optimal (or basic) return on capital. In fact, this is the company's predicted return on equity or an analysis of the trend in this indicator in recent years. In general, the attractiveness of SZH can be calculated based on the ratio:
Attractiveness SZH = aG + bP + cO – dT,
where a, b, c and d are the coefficients of the relative contribution of each factor (total 1.0), G – market growth prospects, P – market profitability prospects, O – positive environmental impacts, T – negative environmental impacts aspects of the environment.
As an example, consider a representation using the BCG matrix strategic positions Randy's hypothetical organization in a number of business areas in the tea market. A study of the organization's business showed that it actually competes in 10 areas of the tea market (Table 1).
Table 1. Characteristics of business areas of Rendi’s organization in the tea market
|
Business area of Randy's organization |
Sales volume/area size, drive, to average |
Annual market growth rates (for 1990-94) |
The organization's largest competitors in a given business area |
Sales volume of the largest competitors |
Relative share of Randy's organization in the market resp. Segment |
|
Varietal tea. USA | |||||
|
Varietal tea. Canada | |||||
|
Varietal tea. Europe | |||||
|
Varietal tea. Third countries | |||||
|
Tea brand "Big Boy" | |||||
|
Tea brand "SmolFry" |
George"sContracts | ||||
|
Herb tea. USA | |||||
|
Herb tea. Export | |||||
|
Fruit tea. USA | |||||
|
Fruit tea. Export |
The BCG model for the considered business areas of Randy’s organization is as follows (Fig. 3).

Rice. 3. BCG matrix of businesses of Rendy’s organization in the tea market
A quick glance at the resulting model suggests that Randy's organization places an undue emphasis on the business area of "US private label tea." This area is in the "dog" category, and although the growth rate of this market segment is quite high (12%), Randy has a very powerful competitor in the form of Cheapco, whose share of this market is 1.4 times greater. Therefore, the profit margin in this area will not be high. If in relation to the future of such a business area as “US private label tea”, one can still think about whether to continue making investments here to maintain its market share or not, then in relation to “varietal tea from Europe”, “varietal tea from Canada" and "high-quality tea from the USA" everything turns out to be extremely clear. We need to get rid of this kind of business as soon as possible. The investment Randy's organization makes in maintaining this business results in neither increased market share nor increased profits. In addition, the market itself for these types of tea shows a clear trend towards fading. It is obvious that Randy's organization clearly does not notice the prospects associated with the development of the market for "USA fruit tea" and "USA herbal tea." These areas of the business are the clear stars. Investments in developing a share of this market could result in significant returns in the near future.
Construction of the BCG matrix in practice
Needs to be developed strategy company regarding its product portfolio, using the technique BCG. To do this, it is necessary to calculate the current indicators of the methodology, build BCG matrix, identify strategically unattractive products and exclude them from production, and then, recalculating the indicators, build new BCG matrix.
|
Product type |
Sales volume, thousand rubles. |
Market share (%), 2003 |
Cost share |
||
|
companies |
show jumping |
||||
|
1. Bagheera toy | |||||
|
2. Toy “Barsik” | |||||
|
3. Toy “Cat Hippopotamus” | |||||
|
4. Toy “Gavryusha” | |||||
|
5. Toy “Dolmatian” | |||||
|
6. Toy “Dragon” | |||||
|
7. Toy “Tiger Zhorik” | |||||
|
8. Toy “Elephant” | |||||
|
9. Toy “Umka No. | |||||
We will produce calculation BCG matrix indicators. Let's calculate the indicator market growth (MR). This indicator characterizes the movement of goods on the market, which is expressed through the change in the volume of sales (sales) of a given product (the result of a given business process) for the last period of time under consideration (in a simplified version, the ratio of sales for the last period to the penultimate period). Hence,
PP1=564.96/256.8=2.2;
PP2=124.4/124.41=0.99992;
PP3=132.95/133.98=0.992312;
PP4=115.0/116.44=0.987633;
PP5=1001.52/256.8=3.9;
PP6=75.18/175.45=0.428498;
PP7=122.99/67.48=1.822614;
PP8=350.92/87.73=4;
PP9=47.69/73.37=0.649993.
Let's calculate the indicator Relative market share (RMS). This parameter is determined by the ratio of the enterprise’s market share to the share of the leading competing company, and the enterprise’s market share is determined as the ratio of sales volume to the market capacity of the product. ODR 1 =8/32=0.25; ODR 2 =50/50=1; ODR 3 =62/31=2; ODR 4 =57/43=1.32558; ODR 5 =2/14=0.14286; ODR 6 =7/6=1.16667; ODR 7 =12/88=0.13636; ODR 8 =6/7=0.85714; ODR 9 =16/32=0.5.
The diameter of the circle, expressed in relative units (the sales volume of one of the goods is taken as a unit), is selected in proportion to the share of the product volume in the sales volume (it is necessary that you can “work” with the matrix, so you need to be careful when choosing a standard).

Let us correlate the resulting diagram with the BCG matrix. The boundaries of the matrix quadrants are shown here by arrows. Each product (product numbers are marked with numbers) produced by a company corresponds to its own quadrant of the BCG matrix. So,
|
Product type |
diameter |
Quadrant BCG |
||
|
1. Bagheera toy |
wild cat |
|||
|
2. Toy “Barsik” | ||||
|
3. Toy “Cat Hippopotamus” |
Cash cow (bordering with star) |
|||
|
4. Toy “Gavryusha” |
Dog (borderline with wild cat) |
|||
|
5. Toy “Dolmatian” |
wild cat |
|||
|
6. Toy “Dragon” | ||||
|
7. Toy “Tiger Zhorik” |
wild cat |
|||
|
8. Toy “Elephant” |
wild cat |
|||
|
9. Toy “Umka No. 2” |
Of the goods produced by the company (as follows from the description of the areas of the BCG matrix), only the “Hippopotamus Cat” toy, which belongs to the “Cash Cows” area (on the border with the “Stars” area), brings a stable profit. When compiling a new product portfolio for a company, you should focus on the most promising products. However, in in this case it turns out that most of the company's products fall into the "Wild Cats" or "Dogs" areas. Products classified as “Wild Cats” are undoubtedly promising, as they are located in rapidly growing markets, but their promotion requires large amounts of investment from the company. financial costs. In this case, a stable influx of funds is provided by only one product, “Hippopotamus Cat,” the profit from the sale of which cannot cover the number of ongoing projects classified as “Wild Cats.”
In addition, the company's portfolio includes four products classified as "Dogs". Typically, these types of products do not bring significant profits and their release is justified only within a dedicated market in the absence of serious risks, on the global market, or in cases where the release of this product gives the company additional competitive advantages. In this case, we are working in a simplified situation, so we will assume that goods classified as “Dogs” are not profitable for the company. In a real situation, it would be necessary to study the detailed information for each product in more detail.
So, we believe that “Dogs” are not profitable for the company, therefore, the company can exclude them from its product portfolio. Four “Wild Cats” require a very large influx of funds, therefore, it is not profitable for the company to produce all these products at the same time. It would be reasonable to single out one or two products (the most promising for the company) and invest in them all the funds that will be freed up from the discontinuation of “Dogs” and additional “Wild Cats”.
Since we work in a simplified situation, we will choose one product that is most promising for the company. In this case, the most promising products are 5 (Dolmatian toy) and 8 (Elephant toy). Product 5 has the largest share in the company’s total sales volume, product 8, having the same level of PP indicator as product 5, has the highest level of ODR indicator among the “Wild Cats”. Let's choose product 8, which has most “advanced” to the “Stars” area of the BCG matrix.
1. Based on the sales indicator (V sales) of the 8th product, we calculate the total V market for this product = (old sales indicator (V sales))/(firm market share for this product) 100 = 350.92/6 100 = 5848.67.
2. For products 1, 2, 4, 5, 6, 7, 9, which are withdrawn from the market, we calculate the total amount intended for redistribution =S(V sales)·(cost coverage) = 282.48+52.248+37, 95+701.064+ 24.058+73.794+25.753=1197.346.
3. Increase in sales (sales) = 1197.346/(coverage of costs of product 8) = 1596.461.
4. New market V=(old market V)+1596.461=5848.67+1596.461=7445.13.
5. New V sales = (old sales (V sales) of product 8) + (sales growth) = 350.92 + 1596.461 = 1947.381.
6. The company’s new market share = (new sales V)/(new market V) = 1947.381/7445.13 = 0.262.
7. V sales of the main competitor = (old V market) · (market share of the main competitor) = 5848.67 · 0.07 = 409.41.
8. New market share of the main competitor = (V sales of the main competitor)/(new V market) = 409.41/7445.13 = 0.055.
9. New ODR =( new share firms on the market)/(new market share of the main competitor) = 0.262/0.055 = 4.76.
10. New PP = (new sales V)/(product sales for the last year 2002) = 1947.381/87.73 = 22.197.
So, new product portfolio will
On practice Usually it is necessary to reconsider various options of actions, the selection of which allows us to develop an optimal strategy for the development of the company’s product profile.

Obtained as a result of analysis using the BCG method product strategy turns out to be very attractive, since it allows, by discontinuing not very promising products, to turn one of the “Wild Cat” products into an undeniable “Star”. Such strategic move will allow the company to gain a strong place in the children's product market and possibly receive necessary funds to promote new (at this stage rejected) products, but this is a matter of future development of strategic lines. However, it should be noted that in practice it is necessary to treat the results obtained with caution and check them multiple times, considering various options future strategy (in order to eliminate missed opportunities).
To analyze the relevance of the company’s products, based on their position in the market relative to the growth of the market for these products and the market share occupied by the company selected for analysis.
This tool is theoretically justified. It is based on two concepts: the product life cycle and economies of scale or learning curve.
The matrix displays the axes of market growth (vertical axis) and market share (horizontal axis). The combination of assessments of these two indicators makes it possible to classify a product, highlighting four possible roles of the product for the company producing or selling it.
Classifications of types of strategic business units
"Stars"
High sales growth and high market share. Market share needs to be maintained and increased. "Stars" bring in a lot of income. But, despite the attractiveness of this product, its net cash flow is quite low, as it requires significant investment to ensure a high growth rate.
"Cash Cows" ("Money Bags")
High market share, but low sales growth rate. “Cash cows” must be protected and controlled as much as possible. Their attractiveness is explained by the fact that they do not require additional investments and at the same time provide a good cash income. Funds from sales can be used to develop “Difficult Children” and support “Stars”.
"Dogs" ("Lame Ducks", "Dead Weight")
The growth rate is low, the market share is low, the product is generally low in profitability and requires a lot of management attention. We need to get rid of the “Dogs”.
"Problem Children" ("Wild Cats", "Dark Horses", "Question Marks")
Low market share, but high growth rates. “Difficult children” need to be studied. In the future, they can become both stars and dogs. If there is a possibility of transferring to the stars, then you need to invest, otherwise, get rid of it.
Flaws
- Great simplification of the situation;
- The model takes into account only two factors, but high relative market share is not the only factor of success, and high growth rates are not the only indicator of market attractiveness;
- Failure to take into account the financial aspect, the removal of dogs can lead to an increase in the cost of cows and stars, as well as a negative impact on the loyalty of customers using this product;
- The assumption that market share corresponds to profit, this rule may be violated when introducing a new product to the market with large investment costs;
- The assumption is that the market decline is caused by the end of the product's life cycle. There are other situations in the market, for example, the end of rush demand or an economic crisis.
Advantages
- theoretical study of the relationship between financial receipts and analyzed parameters;
- objectivity of the analyzed parameters (relative market share and market growth rate);
- clarity of the results obtained and ease of construction;
- it allows you to combine portfolio analysis with a product life cycle model;
- simple and easy to understand;
- It is easy to develop a strategy for business units and investment policies.
Construction rules
The horizontal axis corresponds to the relative market share, the coordinate space from 0 to 1 in the middle in increments of 0.1 and then from 1 to 10 in increments of 1. The assessment of market share is the result of an analysis of the sales of all industry participants. Relative market share is calculated as the ratio of one's own sales to the sales of the strongest competitor or the three strongest competitors, depending on the degree of concentration in a particular market. 1 means that your own sales are equal to those of your strongest competitor.
The vertical axis corresponds to the market growth rate. The coordinate space is determined by the growth rates of all company products from maximum to minimum; the minimum value can be negative if the growth rate is negative.
For each product, the intersection of the vertical and horizontal axis is established and a circle is drawn, the area of which corresponds to the product’s share in the company’s sales volumes.
Links
- Practical methods for developing and analyzing an enterprise’s product strategy based on internal secondary information
Notes
Wikimedia Foundation. 2010.
See what the “BCG Matrix” is in other dictionaries:
MATRIX “GROWTH-MARKET SHARE”, or BCG matrix- one of the most common, classic tools of marketing analysis, and in particular portfolio analysis of company strategies. The matrix gained fame and name thanks to the work of the Boston Consulting Group (BCG, or, in Russian, Boston... ...
BCG (BOSTON ADVISORY GROUP) MATRIX- a two-dimensional matrix with which you can identify winners (market leaders) and establish the degree of balance between enterprises in the context of the four quadrants of the matrix: enterprises that have won large shares market in growing sectors... ... Large economic dictionary
The BCG Matrix (Boston Consult Group, BCG) is a tool for strategic analysis and planning in marketing. Created by the founder of the Boston consulting group, Bruce D. Henderson, to analyze the position of the company’s products in the market... ... Wikipedia
- (product market matrix) an analytical tool for strategic management, developed by the founder of this science, an American of Russian origin Igor Ansoff, and intended to determine a product positioning strategy... ... Wikipedia
PORTFOLIO ANALYSIS- [English] portfolio analysis portfolio analysis] in marketing, analysis of types of products (types of activities or types of projects) using the classification of all product markets of the company according to two independent measurement criteria: market attractiveness and ... ... Marketing. Large explanatory dictionary
Bruce D. Henderson Bruce D. Henderson Occupation: Entrepreneur, author of the BCG Matrix, creator of the Boston Consulting Group Date of birth: 1915 (1915) ... Wikipedia
Henderson, Bruce D Bruce D. Henderson Bruce D. Henderson Occupation: Entrepreneur, author of the BCG Matrix, creator of the Boston Consulting Group Date of Birth: 1915 ... Wikipedia